Performance dashboard

A trading dashboard that grades how you traded

Your results and your process on one screen, so you can tell a good month from a lucky one.
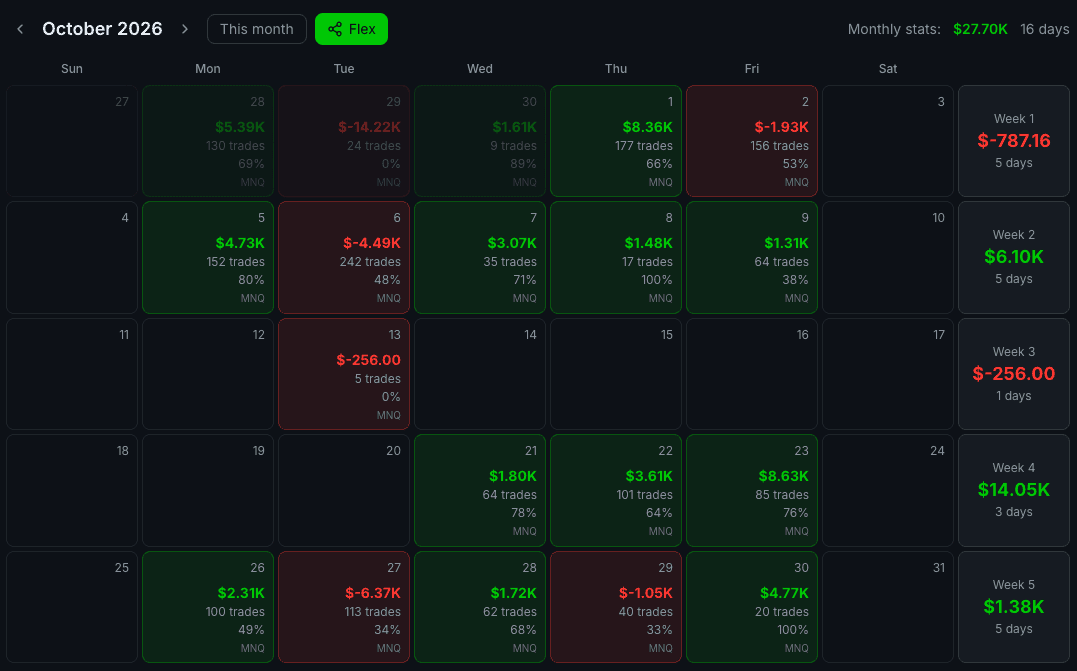
Toreda P&L calendar for October 2026 with daily P&L, trade counts, win rates and weekly totals
The P&L calendar, with weekly totals and the month at a glance.
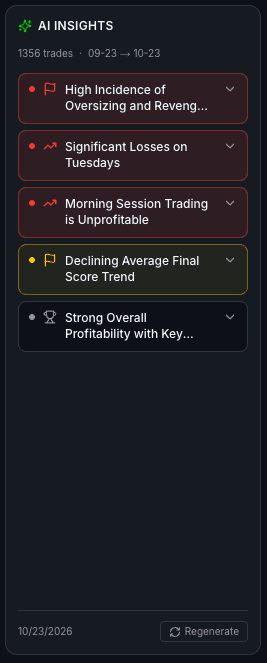
AI Insights panel listing five observations from the last 30 days of trades
AI Insights from your last 30 days.

Most dashboards stop at P&L. Toreda’s puts your results next to how you traded them: every KPI sits beside a Performance Score built from your trade scores, the calendar flags days you have not reviewed yet, and AI Insights point out the patterns behind the numbers.

Your numbers at a glance

Six cards across the top, each with a small trend line so you can see whether it is improving:

  • Avg win/loss: your average winner divided by your average loser.
  • Trade win %: the share of trades that closed green, with wins, ties and losses counted.
  • Day win %: the share of trading days that finished green.
  • Profit factor: total won divided by total lost.
  • Current streak: how many green or red days in a row, with your last 10 days as bars.
  • Performance Score: the average of your trade scores, rated Great (80 and up), Average (50 to 79) or Needs work.
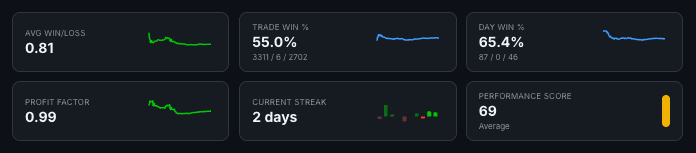
Dashboard KPI cards: avg win/loss 0.81, trade win 55.0%, day win 65.4%, profit factor 0.99, current streak 2 days, Performance Score 69
The six KPI cards, each with its trend line.

Pick a date range and one account or all of them, and the dashboard follows. The Performance Score always averages across all your accounts, because your process is yours, not the account’s.

A P&L calendar you can act on

The calendar shows each day’s net P&L, trade count, win rate and symbols, with weekly totals down the side and the month’s total up top. Days with trades you have not scored show a count, so nothing slips through.

Click a day to open it: an intraday equity curve, total trades, gross P&L, winners and losers, commissions, win rate and profit factor, then every trade with its time, side, net P&L and ROI. Score them one by one or hit Score All to bulk score the day.

Had a day worth sharing? The Flex button turns your P&L into a share card.

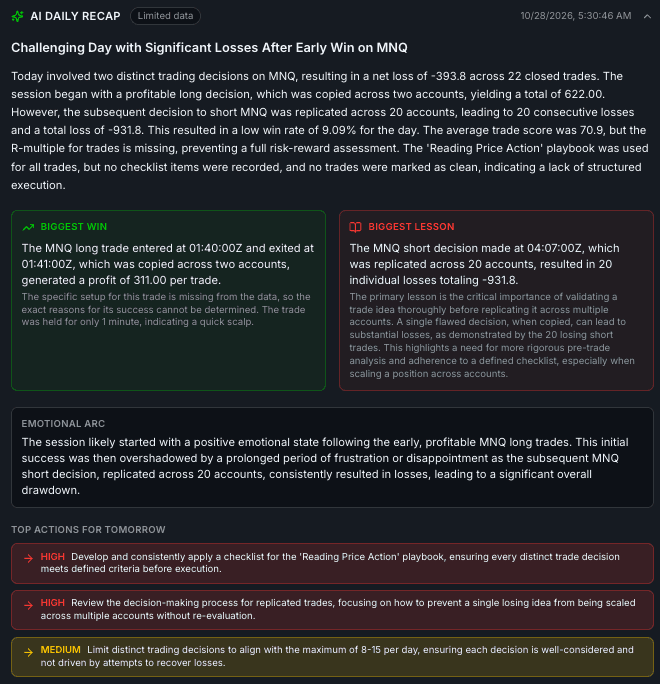
The day view also carries your AI Daily Recap, written after each session: what happened, your biggest win and biggest lesson, the emotional arc of the day and the top actions for tomorrow.
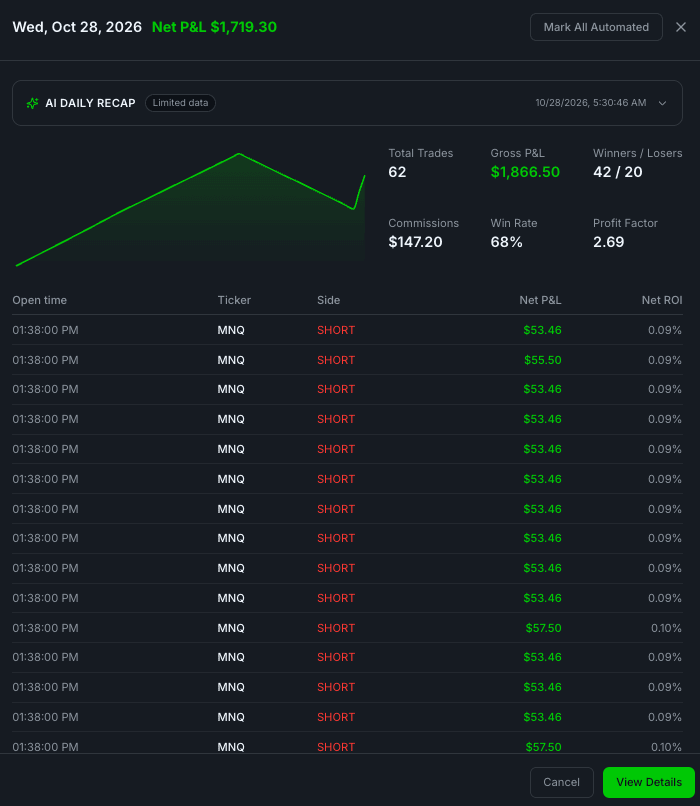
Day view for Oct 28, 2026: equity curve, 62 trades, gross and net P&L, commissions, win rate, profit factor and the trade list
Click a day: its stats and every trade.
AI Daily Recap with a summary of the session, biggest win, biggest lesson, emotional arc and top actions for tomorrow
The AI Daily Recap for the same day.

AI Insights on the dashboard

Next to the calendar, AI Insights reads your last 30 days and surfaces 3 to 5 observations, such as repeat mistakes, your best time of day and the setups that are working. Each one leads with the pattern and backs it with your numbers. It is included in every plan, alongside Eda, the AI assistant.

Charts that show where your edge is

  • Net daily P&L and cumulative P&L for the period you picked, after fees.
  • Account balance: your starting balance plus your cumulative P&L, day by day.
  • Drawdown: how far you are from your peak balance. It returns to zero at every new high.
  • Best trading sessions: average P&L per trade for the morning open, midday, afternoon and overnight sessions.
  • Best trade days: average P&L per trade for each weekday.
  • Hold time: how long your winners and losers last, side by side.
  • Playbook P&L and best playbook by day: which of your playbooks make money, and on which days.
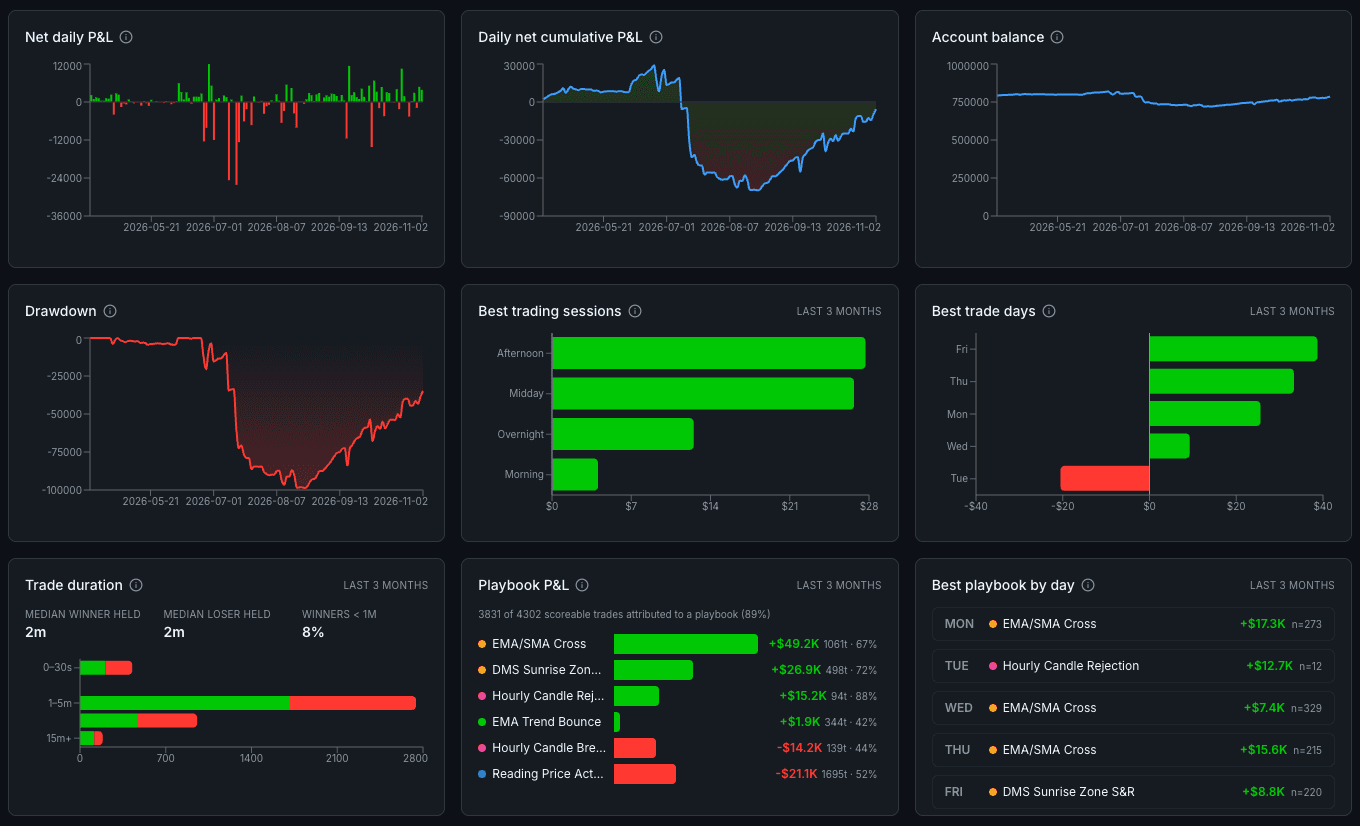
Dashboard charts: net daily P&L, cumulative P&L, account balance, drawdown, best trading sessions, best trade days, trade duration, playbook P&L and best playbook by day
The charts below the calendar.

Sessions, weekdays and playbooks use your last 3 months, so a single great week does not decide which setup is your best.

On your phone too

On a phone the dashboard swaps the month grid for a week strip you can swipe through, with the same KPIs and charts. Add Toreda to your home screen and it opens full-screen like an app.
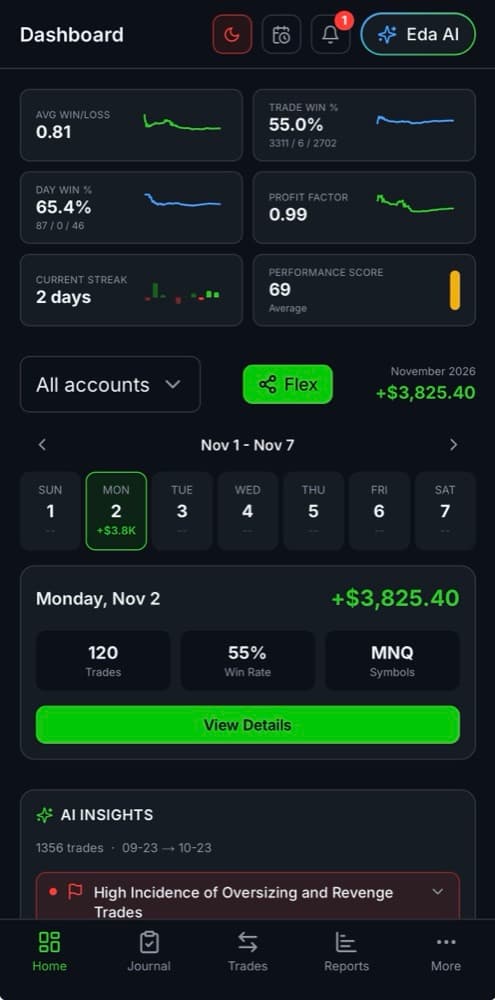
Toreda dashboard on a phone: KPI cards, week strip, day summary and AI insights
The dashboard on a phone, installed to the home screen.

Frequently asked questions

What is the Performance Score on the dashboard?
The average of your trade scores for the date range you pick, across all your accounts. Each trade is scored from 0 to 100 on how you traded it, so the Performance Score shows your process, not your P&L. 80 and up is Great, 50 to 79 is Average, and below that is Needs work.
How is profit factor calculated?
Total profit from winning trades divided by total loss from losing trades. Above 1 means you made more than you lost.
Can I filter the dashboard by account?
Yes. Pick one account or all of them, and a date range. Every card and chart follows, except the Performance Score, which always averages across all accounts.
Are fees included in the P&L?
Yes. P&L on the dashboard is net of fees and commissions, and the day view shows commissions separately.
Is AI Insights included in my plan?
Yes. AI Insights is included in every Toreda plan.

Ready to journal your trades with Toreda?

Start your free trial

This content is for educational purposes only and is not financial advice. Trading involves substantial risk of loss. See our risk disclosure for details.

Disclaimer

Toreda is a product of Bearcat Solutions, a company registered in the U.S. and its affiliates (collectively, the “Company”). Toreda is a trade journaling, performance analytics, and AI coaching platform designed to help traders log, review, and improve their trading. None of the information provided by the Company or contained herein is intended as investment advice, as any offer or solicitation to buy or sell securities of any kind, or as a recommendation, endorsement, or sponsorship of any security, company, or fund. Nothing contained herein constitutes a solicitation of any kind or an offer to buy or sell futures, options, forex, or any other derivative security. The performance dashboards, trade scores, AI coach insights, and analytics provided through Toreda are for informational and educational purposes only and are not intended to be relied upon for making investment decisions. Any use of the information on the Company's websites and platform is strictly at your own risk, and the Company assumes no responsibility or liability for any use or misuse of such information. Past performance is not indicative of future results, and every investment involves risks, including the possibility of total loss of the amount invested. You should always seek professional advice before making any investment decisions. The Company is not a financial broker, financial advisor, financial manager, or a financial representative, and does not accept client deposits.

Toreda does not offer or provide trading or investment recommendations. The AI Coach feature provides analytical insights based on your own trade history — it does not recommend specific trades, securities, or strategies. Any trading or investment decisions you make are entirely your responsibility and at your own risk. The results of any services provided by Toreda are directly related to each individual's professional skill level, trading discipline, and their capacity to apply the insights provided.

Disclosure on Performance Data

The performance metrics, scores, equity curves, and analytics displayed within Toreda are calculated from trade data imported from your connected broker accounts or manually entered by you. These metrics reflect historical results and have inherent limitations. No claim is made that any trading approach tracked in Toreda will achieve or is likely to achieve future profits or losses comparable to those shown. Actual trading results can differ significantly from historical performance data. Performance analytics benefit from hindsight and cannot account for all market factors, emotional decision-making, or evolving market conditions that affect real-time trading. Many factors — including slippage, commissions, market liquidity, and individual execution — can adversely affect actual trading results beyond what is reflected in the platform's analytics.


NinjaTrader® is a registered trademark of NinjaTrader Group, LLC. No NinjaTrader company has any affiliation with the owner, developer, or provider of the products or services described herein, or any interest, ownership or otherwise, in any such product or service, or endorses, recommends or approves any such product or service.


© 2026 Toreda. All rights reserved.